Burglary in Oakland, reports through Oct 29, 2026
Where are homes and businesses being broken into?
Burglary is 13% below last year, comparing January 1 to Jun 30, 2026 with the same dates in 2025; June 2026, the last full month, was 6% below. This family is 5% of everything reported to OPD. Burglary means entering a building to commit a crime. We separate residential, commercial and other burglaries; breaking into a parked car is counted under vehicle crime, not here.
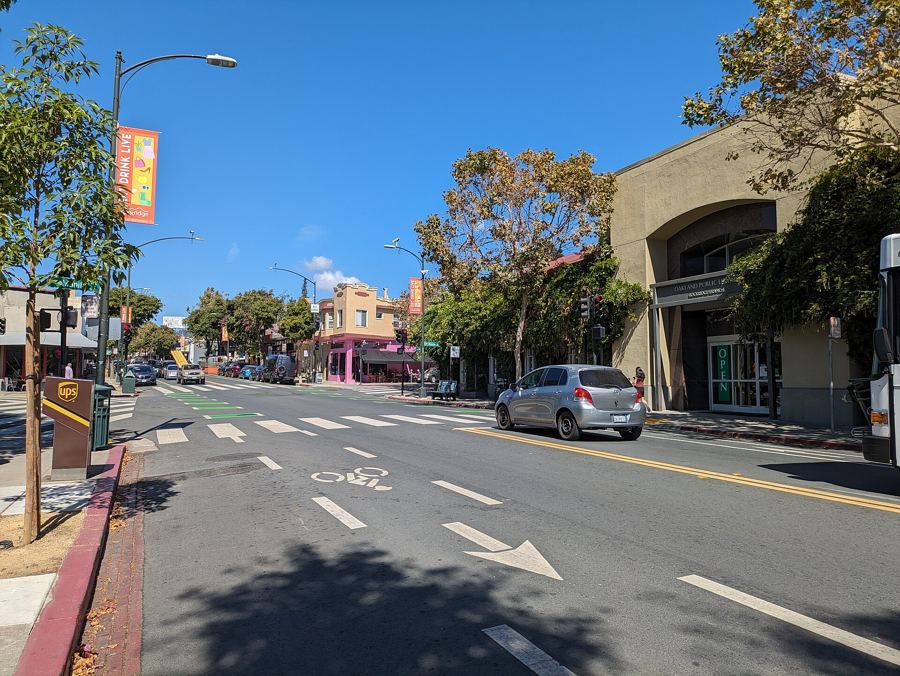
Photo: Mx. Granger, CC0

- This year so far
- 1,033down 13% vs. the same dates in 2025
Jan 1–Jun 30 - June 2026, last full month
- 172down 6% vs. June 2025
- Share of all reports
- 5%last 12 months
Burglary by month, 2025–2026
calendar months; the latest three are still filling in- Burglary
Burglary categories
Oct 29, 2025–Oct 29, 2026- Burglary - Residential929
- Burglary - Commercial742
- Burglary - Other210
By hour of day
Oct 29, 2025–Oct 29, 2026, 12 am often means time unrecordedPolice beats with the most reports
Oct 29, 2025–Oct 29, 2026- Oaktree/Hawthorne police beat 20X172
- Coliseum Melrose police beat 26X101
- Uptown police beat 04X96
- Greater San Antonio police beat 19X86
- Northgate police beat 08X77
- Chinatown police beat 03X68
- Peralta police beat 07X60
- Jack London police beat 01X53
By year, 2016–2026
2026 is year to date; earlier bars are complete yearsLatest burglary reports
Oct 15–29, 2026, newest first, up to 401 report
- Burglary - Commercial1100 24th StPeralta 07X
1 report
- Burglary - Commercial2400 International BlvdOaktree/Hawthorne 20X
3 reports
- Burglary - Commercial1900 Mandela PkwyLowell/Acorn 05X
- Burglary - Residential7100 Saroni DrMontclair 13Z
- Burglary - Residential1200 106th AvNorth Stonehurst 32X
1 report
- Burglary - Residential100 Santa Clara AvGrand Lake 14Y
3 reports
- Burglary - Commercial5200 Coliseum WyColiseum Melrose 26X
- Burglary - Residential1700 27th AvOaktree/Hawthorne 20X
- Burglary - Residential2300 Valley StNorthgate 08X
3 reports
- Burglary - Other700 Kennedy StGreater San Antonio 19X
- Burglary - Commercial00 Grand AvNorthgate 08X
- Burglary - Commercial1500 Franklin StUptown 04X
1 report
- Burglary - Commercial3400 Hollis StPeralta 07X