Violent crime in Oakland, reports through Oct 29, 2026
Are homicides, robberies and assaults rising or falling?
Violent crime is 23% below last year, comparing January 1 to Jun 30, 2026 with the same dates in 2025; June 2026, the last full month, was 29% below. This family is 7% of everything reported to OPD. Violent crime uses the Oakland Police Department's own definition: homicide, robbery, felony (aggravated) assault and rape. Misdemeanor assault and domestic-violence reports are not included, matching how OPD reports its crime statistics.
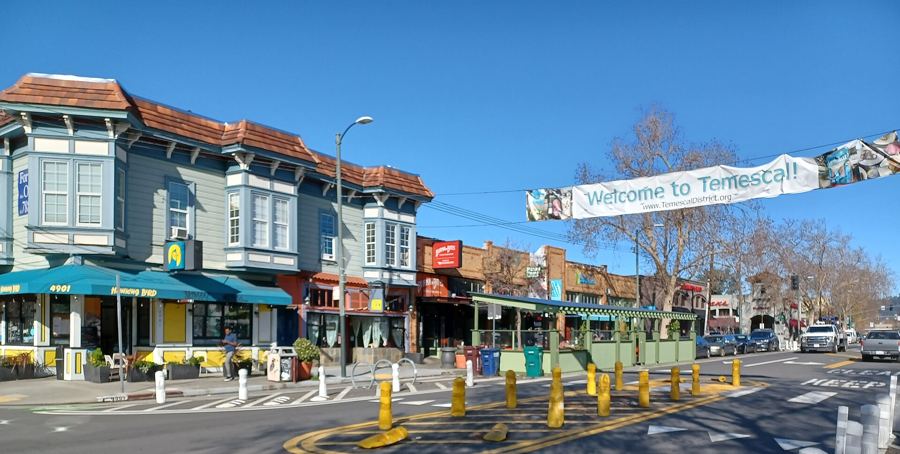
Photo: Mx. Granger, CC0

- This year so far
- 1,428down 23% vs. the same dates in 2025
Jan 1–Jun 30 - June 2026, last full month
- 208down 29% vs. June 2025
- Share of all reports
- 7%last 12 months
Violent crime by month, 2025–2026
calendar months; the latest three are still filling in- Violent crime
Violent crime categories
Oct 29, 2025–Oct 29, 2026- Felony Assault1,390
- Robbery1,105
- Forcible Rape139
- Homicide54
By hour of day
Oct 29, 2025–Oct 29, 2026, busiest around 10 pmPolice beats with the most reports
Oct 29, 2025–Oct 29, 2026- Greater San Antonio police beat 19X155
- Uptown police beat 04X137
- Arroyo Viejo/Hegenberger/Havenscourt police beat 30X123
- Fruitvale police beat 23X102
- Northgate police beat 08X95
- Webster police beat 34X91
- North Stonehurst police beat 32X91
- Hoover/Foster police beat 06X84
By year, 2016–2026
2026 is year to date; earlier bars are complete yearsLatest violent crime reports
Oct 15–29, 2026, newest first, up to 401 report
- Forcible Rape3500 Dimond AvFruitvale 22X
5 reports
- Robbery500 Bellevue AvAdams Point 14X
- Forcible Rape1800 EmbarcaderoGreater San Antonio 19X
- Robbery7200 Bancroft AvEastmont Hills 30Y
- Robbery3300 E 12th StFruitvale 23X
- Felony Assault15600 Skyline Blvd77X
3 reports
- Homicide51st Av & E 12th StColiseum Melrose 26X
- Felony Assault1200 International BlvdGreater San Antonio 19X
- Felony Assault2100 Macarthur BlvdFruitvale 22X
3 reports
- Robbery3500 Pierson StMaxwell Park 28X
- RobberyFruitvale Av & Foothill BlvdFruitvale 23X
- Felony Assault2300 International BlvdOaktree/Hawthorne 20X
3 reports
- Robbery5300 Fairfax AvMelrose-High Hopes 27X
- Felony Assault800 71st AvColiseum 26Y
- Robbery100 14th StUptown 04X
5 reports
- RobberySanta Rita St & High StMelrose-High Hopes 27X
- Forcible Rape600 Hegenberger RdBrookfield/Columbian Gardens/Sobrante Park 31Y
- Felony Assault1100 62nd StGolden Gate 10X
- Robbery00 Hegenberger RdBrookfield/Columbian Gardens/Sobrante Park 31Y
- Robbery3600 Loma Vista AvLaurel/Redwood/Leona Heights 25X
6 reports
- Felony Assault700 Willow StPrescott 02Y
- Felony Assault3000 38th AvAllendale Park 24Y
- Robbery2800 International BlvdOaktree/Hawthorne 20X
- Felony Assault500 3rd StJack London 01X
- Felony Assault1300 87th AvWoodland/Highland/Elmhurst Park 33X
- Felony Assault2200 Telegraph AvNorthgate 08X
4 reports
- Felony Assault1100 Wood StPrescott 02Y
- Felony Assault1200 54th AvColiseum Melrose 26X
- Felony Assault9900 Macarthur BlvdMacArthur/Iveywood/Durant Manor 32Y
- Felony Assault600 Almanza DrSobrante Park 31Z
10 reports
- Felony Assault300 E 18th StCleveland Heights 15X
- Felony Assault91st Av & B StWoodland/Highland/Elmhurst Park 33X
- Robbery2200 Telegraph AvNorthgate 08X
- Felony Assault86th Av & International BlvdWebster 34X
- Robbery600 42nd StTemescal 12X
- Felony Assault3500 Foothill BlvdHarrington 24X
- Felony Assault800 E 24th StBella Vista 17Y
- Felony Assault400 Hale AvBrookfield/Columbian Gardens/Sobrante Park 31Y
- Robbery600 15th StUptown 04X
- Felony Assault6600 Bancroft AvMillsmont 29X